Pythonで機械学習(kaggle入門その3)
はじめに
前回の続き「House Prices: Advanced Regression Techniques」をやっていきます。 今回はモデルの構築、予測を行いたいと思います。
【Pythonで機械学習・予測】
1.モデル投入データの事前準備
住宅価格と相関が高い変数を抽出しモデル投入データを作成する。
# 訓練用データから説明変数を取得
x_train = train[['OverallQual','GrLivArea','GarageCars','GarageArea','TotalBsmtSF']].copy()
# 訓練用データから目的変数を取得
y_train = train['SalePrice'].copy()

# 作成したデータの要素数を確認
print(x_train.shape, y_train.shape)
(1460, 5) (1460,)
テストデータも欠損値補完等の事前準備を実施。
# テストデータの事前処理
# 欠損値補完
for column in test.columns:
    if test[column].dtypes == 'object':
        test[column] = test[column].fillna('NA')
    if test[column].dtypes in ('int32','int64','float64'):
        test[column] = test[column].fillna(0)

# カテゴリデータを数値に変換
for column in test.columns:
    if test[column].dtypes == 'object':
        label_encoder = LabelEncoder()
        label_encoder.fit(test[column])
        test[column] = label_encoder.transform(test[column])

# テストデータから説明変数を取得
x_test = test[['OverallQual','GrLivArea','GarageCars','GarageArea','TotalBsmtSF']].copy()

# 作成したデータの要素数を確認
print(x_test.shape)
(1459, 5)
2.モデル作成及びスコアリング
今回も「Taitanic」と同様に
決定木
ランダムフォレスト
ロジスティック回帰
の手法にてモデルを作成した。
- 決定木
# 決定木モデル作成
decision_tree = DecisionTreeClassifier(random_state=0)
# 訓練用データの説明変数と目的変数にて学習
decision_tree = decision_tree.fit(x_train, y_train)
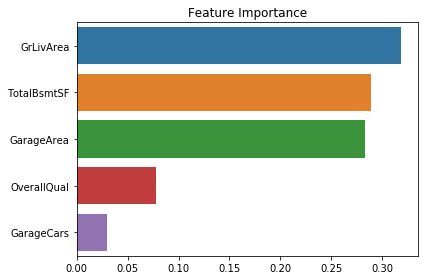
# feature_importances_関数で特徴量の重要度を確認
rank = np.argsort(-decision_tree.feature_importances_)
sns.barplot(x=decision_tree.feature_importances_[rank], y=x_train.columns.values[rank], orient='h')
plt.title('Feature Importance')
plt.tight_layout()
plt.show()

# モデルにテストデータを投入し予測
y_pred = decision_tree.predict(x_test)
Id = np.array(test["Id"]).astype(int)
result = pd.DataFrame(y_pred, Id, columns = ["SalePrice"])
# 予測データの確認
result.head(10)
| SalePrice | |
|---|---|
| 1461 | 123000 |
| 1462 | 158000 |
| 1463 | 143000 |
| 1464 | 181000 |
| 1465 | 245500 |
| 1466 | 188000 |
| 1467 | 173000 |
| 1468 | 163990 |
| 1469 | 181134 |
| 1470 | 68400 |
# 予測データをCSVファイルに出力
result.to_csv("decision_tree_result.csv", index_label = ["Id"])
- ランダムフォレスト
# ランダムフォレストモデル作成
random_forest = RandomForestClassifier(n_estimators=100)
# 訓練用データの説明変数と目的変数にて学習
random_forest.fit(x_train, y_train)
RandomForestClassifier(bootstrap=True, class_weight=None, criterion='gini',
                       max_depth=None, max_features='auto', max_leaf_nodes=None,
                       min_impurity_decrease=0.0, min_impurity_split=None,
                       min_samples_leaf=1, min_samples_split=2,
                       min_weight_fraction_leaf=0.0, n_estimators=100,
                       n_jobs=None, oob_score=False, random_state=None,
                       verbose=0, warm_start=False)
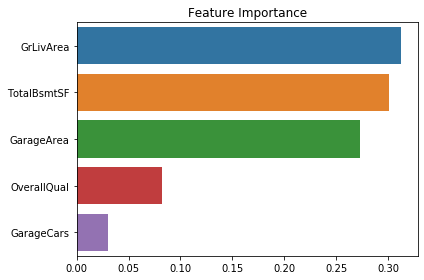
# feature_importances_関数で特徴量の重要度を確認
rank = np.argsort(-random_forest.feature_importances_)
sns.barplot(x=random_forest.feature_importances_[rank], y=x_train.columns.values[rank], orient='h')
plt.title('Feature Importance')
plt.tight_layout()
plt.show()

# モデルにテストデータを投入し予測
y_pred = random_forest.predict(x_test)
Id = np.array(test["Id"]).astype(int)
result = pd.DataFrame(y_pred, Id, columns = ["SalePrice"])
# 予測データの確認
result.head(10)
| SalePrice | |
|---|---|
| 1461 | 129000 |
| 1462 | 158000 |
| 1463 | 130000 |
| 1464 | 181000 |
| 1465 | 245500 |
| 1466 | 177500 |
| 1467 | 162000 |
| 1468 | 178900 |
| 1469 | 180000 |
| 1470 | 120500 |
# 予測データをCSVファイルに出力
result.to_csv("random_forest_result.csv", index_label = ["Id"])
- ロジスティック回帰
# ロジスティック回帰モデル作成
logistic_regression = LogisticRegression()
# 訓練用データの説明変数と目的変数にて学習
logistic_regression.fit(x_train, y_train)
LogisticRegression(C=1.0, class_weight=None, dual=False, fit_intercept=True,
                   intercept_scaling=1, l1_ratio=None, max_iter=100,
                   multi_class='warn', n_jobs=None, penalty='l2',
                   random_state=None, solver='warn', tol=0.0001, verbose=0,
                   warm_start=False)
# モデルにテストデータを投入し予測
y_pred = logistic_regression.predict(x_test)
Id = np.array(test["Id"]).astype(int)
result = pd.DataFrame(y_pred, Id, columns = ["SalePrice"])

# 予測データの確認
result.head(10)
| SalePrice | |
|---|---|
| 1461 | 120500 |
| 1462 | 135000 |
| 1463 | 190000 |
| 1464 | 140000 |
| 1465 | 140000 |
| 1466 | 140000 |
| 1467 | 180000 |
| 1468 | 140000 |
| 1469 | 140000 |
| 1470 | 110000 |
# 予測データをCSVファイルに出力
result.to_csv("logistic_regression_result.csv", index_label = ["Id"])
3.予測データの提出&スコア確認
予測データをアップしたところ、スコアは一番よいものがランダムフォレストの「0.22419」というビミョーな結果でした。 スコアは、真値からの二乗平均平方根誤差(RMSE)で評価されているのでスコアがより小さいほうがよいモデルになります。
今回は、データクレンジングや各モデルのチューニングをほとんどしていなかったのであまり精度がでませんでした。 その辺を改善するのと別の分析手法でもまた挑戦したいと思います。